Home / Blog / How does the BET surface area analyzer measure pore size distribution?
How does the BET surface area analyzer measure pore size distribution?
05 11 月, 2025From: BSD Instrument

1. Theoretical Foundations of BET Analysis
2. Experimental Workflow
Sample Preparation
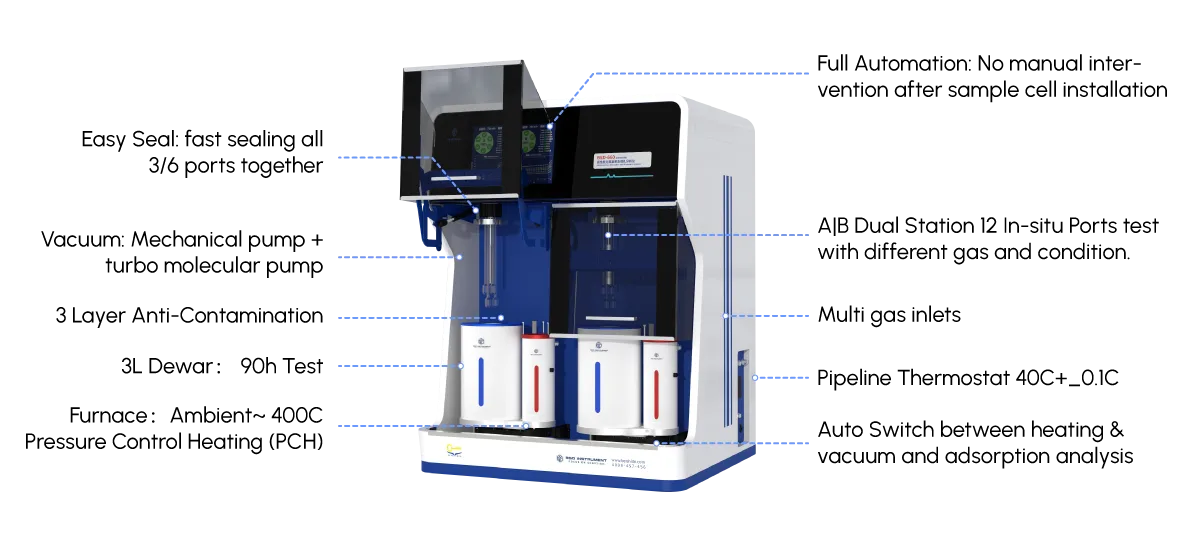
Degassing: Samples are pretreated under vacuum or inert gas at elevated temperatures (e.g., 200–350°C) to remove physisorbed contaminants like water or hydrocarbons. This step ensures accurate adsorption measurements . Sample Loading: The degassed sample is loaded into a sample cell, which is then sealed and cooled to cryogenic temperatures.
Adsorption Isotherm Measurement
Nitrogen Adsorption: The analyzer gradually increases the relative pressure () from 0.05 to 0.995, measuring the equilibrium adsorbed gas volume at each step. This generates an adsorption isotherm, which reflects the material’s pore structure . Desorption Isotherm: After saturation, pressure is decreased to record desorption data, which helps analyze pore filling and emptying mechanisms.
3. Pore Size Distribution Analysis
Barrett-Joyner-Halenda (BJH) Method
Principle: The BJH model uses Kelvin’s equation to relate adsorption isotherms to pore diameters. It assumes cylindrical pores and calculates pore volumes based on capillary condensation at specific values. Application: Primarily used for mesopores (2–50 nm). BJH plots adsorbed volume vs. pore diameter, creating a distribution curve .
Non-Local Density Functional Theory (NLDFT)
Advancements: For micropores (<2 nm), BJH underestimates pore volumes due to interactions between adsorbed layers. NLDFT addresses this by incorporating quantum mechanical effects, providing accurate micropore characterization. It is now standardized in ISO 15901-3 .
Data Interpretation
Adsorption vs. Desorption: Adsorption isotherms are preferred for pore size analysis to avoid artifacts like the "4 nm spike" caused by desorption hysteresis in composite pore systems . Software Tools: Modern analyzers use software (e.g., Gold APP’s V-Sorb) to automate data fitting, generate pore size histograms, and export reports .
4. Key Applications
Catalysts: Evaluating pore structures to optimize active site accessibility . Energy Materials: Analyzing battery electrodes and fuel cells for pore-related performance metrics . Environmental Science: Characterizing adsorbents (e.g., activated carbon) for pollutant removal .
5. Limitations and Considerations
Closed Pores: BET cannot assess pores inaccessible from the surface . Sample Requirements: Requires sufficient sample quantity (0.5–6 cm³) and homogeneous particle size . Pressure Range: Accuracy diminishes outside for BET and 2–50 nm for BJH .
Conclusion
Our Latest Blog & Articles
Stay updated with our latest news. Discover new product launches, innovative technologies, and upcoming events. Join our community and stay informed about all things lab equipment.
-
4 2 月, 2026
How Pore Size Analyzers Enable Breakthroughs in Catalyst and Battery Research
-
16 1 月, 2026
Advanced Applications of BET Adsorption Instrument in Nanomaterial Characterization
-
6 1 月, 2026
Advanced Characterization of Porous Materials Using a BET Adsorption Analyzer: Principles and Applications
-
29 12 月, 2025
Static Adsorption Mechanisms: A Comprehensive Review of Theoretical Models


